UPDATED STATS
OTLA continues to make periodic Freedom of Information requests to the LAT.
The 2020 blog about this is here: https://otlablog.com/updated-lat-statistics/.
The 2021 blog about this is here: https://otlablog.com/2021-another-year-of-the-lat-and-it-isnt-getting-faster/
We now have the LAT stats up to Q2 2023-2024.
Here’s what I said on a previous LAT stat blog:
“Not surprising, the LAT is not getting any faster. And, even more not surprising, the same insurers are still creating a lot of LAT disputes.”
That is still true.
As usual, here are some quick “take aways” before the actual stats:
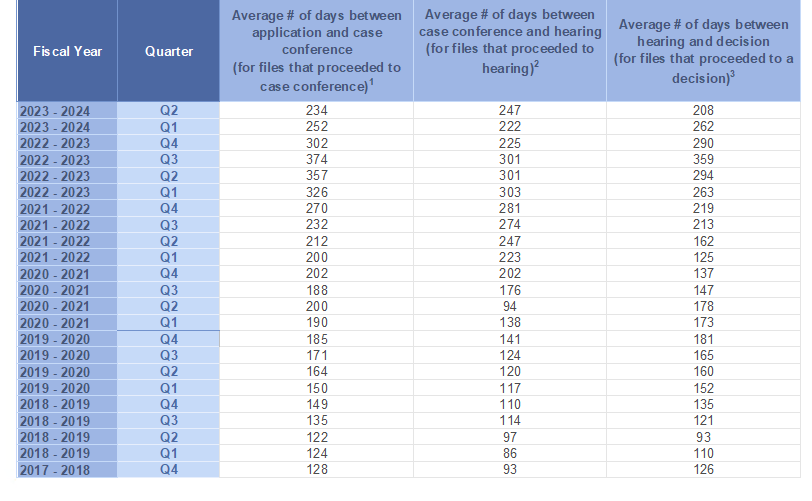
- The average time between application and decision is now 854 days. While there was a slight drop in the last quarter, overall, this has steadily increased since the LAT took over AB disputes. In fact, the LAT is now almost three times as slow as it was when it first took over AB disputes (compared to 323 days in 2017-2018 Q4)
- The average time between each litigation step (application, case conference, hearing) has had some improvement in the last year. So, the LAT is getting faster by that metric.
- The average time for release hearing decisions has improved.
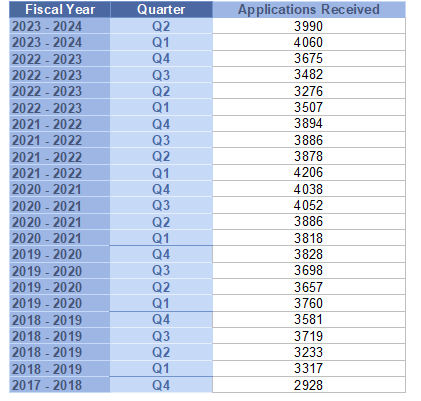
- Applications remain high, with 2023-2024 Q1 setting a “record” with 4,060 (in that quarter alone). Roughly 16,000 accident benefit disputes per year should tell the LAT, FSRA and the Ontario Government something… insurers deny a lot of claims!
Here are the updated results:
Number of applications received by quarter
Various items relating to length of time: average length of time by quarter
Now for the insurers.
Perhaps shockingly to those that follow my LAT blog posts, Aviva has lost their stranglehold on top spot for “Most LAT Applications”.
Here are the top 5 insurers at the LAT (by applications in 2023-2024 Q2 and by my count):
- Intact (including Belair, Jevco, RSA, Unifund): 820
- Certas (including Desjardins and The Personal): 530
- Aviva: 509
- Allstate (including Pembridge and PAFCO): 420
- TD: 354
To some extent, it makes sense that certain insurers have high numbers. They are big insurers with big market shares. And there has been market consolidation in recent years. That said, it is troubling when one insurer accounts for 20% of all accident benefit disputes.
FSRA has oversight over insurance companies as the regulator! They should see that applications remain high and that means that insurance company denials remain high. And, there are certain insurers that cause a large amount of the denials/disputes. FSRA should take action.